Most methods that were presented here so far are dealing with a single time series (performance metric) at a time. Now I’d like to make a quick overview of methods which allow to glance over a whole collection of time series at once.
Data used here was gathered during a load test of an application which consists of several components: http server, messaging server (RabbitMQ), database (Cassandra). That application uses 5 hosts and number of system metrics + application metrics is about 3300 after filtering (~32000 before). Think of it as a number of graphs to get through while exploring results of the test.
The load applied to the http server looks like this (number of identical clients sending requests):

The idea behind the table hill shape of the load is that the upwards slope shows when the system breaks (how it scales), flat top shows how stable it is (if it didn’t break on upwards slope), and the downwards slope shows how it recovers.
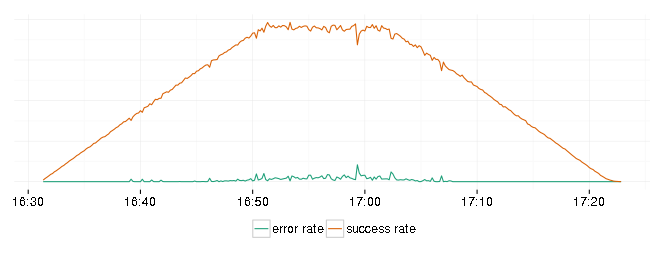
The service didn’t do very well this time. Here is a plot of successful and error response rates:

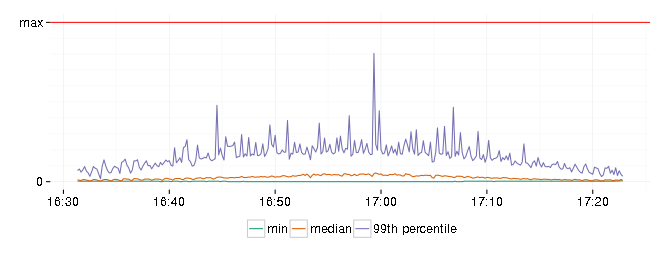
And response latencies:

Error rate is not zero and 99th percentile of response latency has spikes close to allowed by SLA maximum. At least it recovered and continued to serve requests at a lower rate.
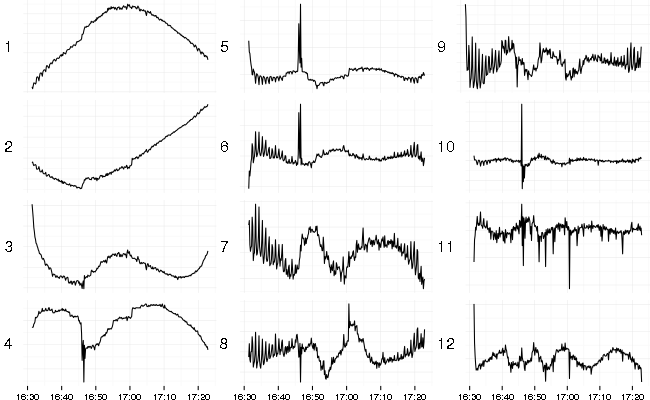
Here’s what a result of SVD (Singular Value Decomposition) looks like (left-singular vectors sorted by decreasing singular values):

In time series context SVD decomposes original set of series into set of uncorrelated base series (left-singular vectors), set of singular values, and a matrix of weights (right-singular vectors). These matrices could be used to reconstruct the original set of series. The nice feature is that you can take only several base series corresponding to the top singular values to get quite good (in terms of squared error) reconstruction result.

First 6 singular values (sorted by decreasing value) contribute most and the rest is a background noise.
When the data is centered (mean subtracted) and scaled (divided by standard deviation) before applying SVD then the top (by singular values) base series represent the most common shapes in the data with some caveats. Sometimes it can change sign (flip shape vertically) or mix several common shapes into one. Outliers distort extracted base series due to the scaling used and the least-squares nature of the decomposition (which amplifies outliers).
In this case the first extracted series is a slightly skewed table hill shape of the load applied because most metrics follow that pattern. A lot of metrics comes from Cassandra which uses exponentially decaying sampling for latencies. This algorithm smoothes and moves the shape to the right (delays signal). The second extracted series corresponds to growing counters and caches. The third series looks like a flipped shape of RabbitMQ disk activity during the test. There are some spikes and drops visible on several base series which corresponds to errors and latency spikes.
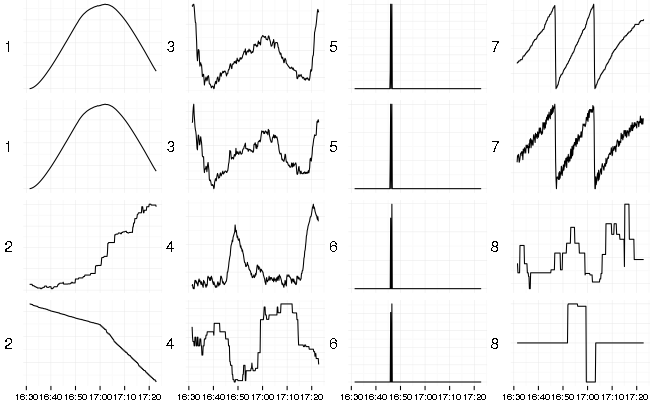
Closely related PCA (Principal Component Analysis) produces set of principal components (which are base series from SVD scaled by singular values) and the same weights (loadings) from SVD. Here the first 2 original series selected by maximum absolute loading per each principal component.

It selects original series which have largest contribution from top components (base series).
These methods are quite fast and produce meaningful results: they extract the most common shapes and group original series by these shapes.
They are sensitive to outliers. The usual way of scaling data (by standard deviation) doesn’t make a lot of sence for long tailed distributions which are quite common in performance monitoring data. It might be a good thing for exploratory data analysis because if you see some spikes or step-like changes in several first base series then it definitely means some abrupt changes at that time in system being monitored.
I’ve tried to center data by subtracting median and scale by MAD (Median Absolute Deviation) but discovered that zero MAD is quite common in my data (when it’s mostly constant with a few spikes).
What SVD/PCA are good for: if you have a lots of data, slow anomaly detection algorithm and interested mostly in the time when anomaly happens then running the algorithm on several first principal components might be much faster than feeding it all the original data.