Most anomaly detection methods for time series expect it to be flat (not changing over time) and they find when it stops being flat. But real data that comes from system monitoring is not flat. People are active during business hours and sleep at night so system usage metrics are higher during daytime. Weekends usually have lower usage metrics for business apps and higher for entertainment. That difference between daytime and nighttime (and weekend vs. middle of the week) needs to be removed somehow before applying anomaly detection algorithm.
Holt-Winters is popular for such data but it puts more weight into last observations so if you had public holiday or outage last week it’ll expect the same dip next week leading to false positive.
There are several methods described at chapter 6 Time series decomposition of Forecasting: principles and practice that allow to split time series into seasonal and non-seasonal components.
I needed to process several thousands metrics so the most simple and fast Classical decomposition was chosen first. Here’s an example weekly decomposition of 35 days of Wikipedia pageviews data using decompose function from R:
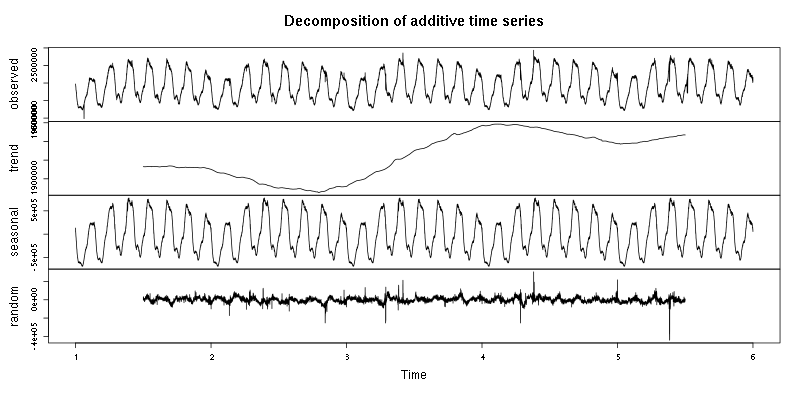
The decomposition removes most of daily and weekly variation from the data and allows to see outliers more clearly in the remainder component (labeled as ‘random’).
In the next example I injected 2 hours long outage (zero pageviews) into the data and did the same decomposition:
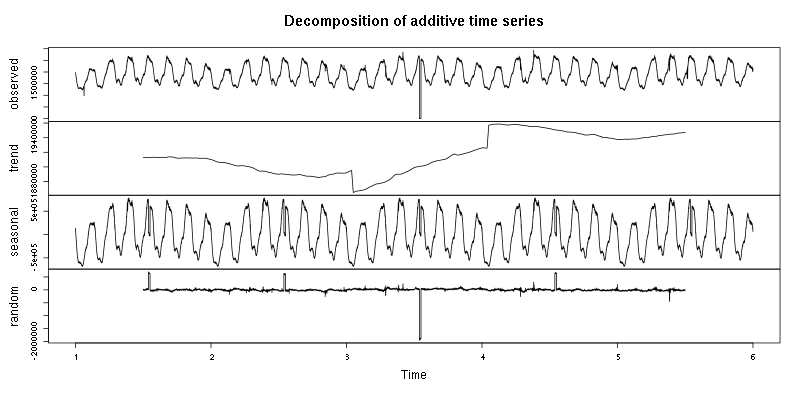
The single outage managed to corrupt extracted trend and seasonal component and introduced false outlier in the remainder for each week. It happens because the method uses moving average to get trend component out and then averages values for the same time during several seasons (e.g. average 10AM value on Mondays if period length is 1 week). (Moving) average is not robust in presence of outliers so I decided to try median instead.
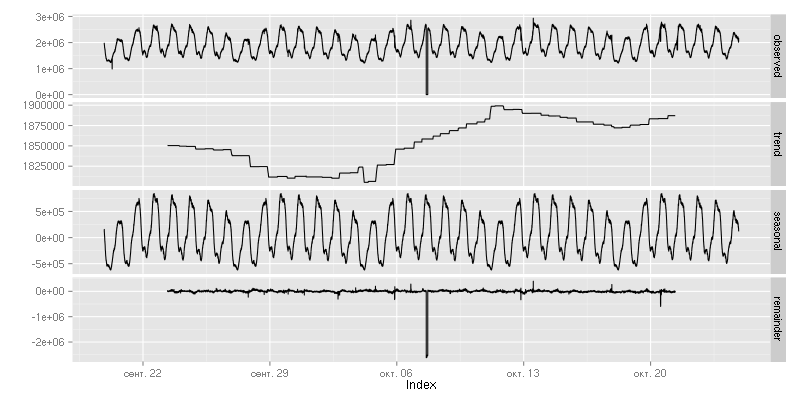
This decomposition looks much better than the previous one but there are several caveats.
High resolution data doesn’t mean better seasonal extraction because current 10s don’t have to be the same as 10s exactly one week ago. But the current hour has to be similar to the same hour of day week ago if there is no holidays, outages, extremely successful marketing campaigns, etc.
Median filter leaves abrupt steps in extracted trend. That means that if you are looking for step-like anomalies then you can’t just process remainder. Step might be hiding in the trend component so it’s better to remove only seasonal component from signal (use trend + remainder for step detection).
Periods of odd length are better for median calculation because there is no interpolation in that case. Same reason applies to seasonal component extraction. Since one season is lost due to left and right padding during filtering then even number of periods is better.