This time I’m going to introduce tools for visual data exploration. They represent each time series as a point in 2-dimensional space. When original time series are similar the corresponding points will be close to each other.
The same data was used here as in previous post about SVD and PCA
Multidimensional Scaling (MDS) produces this kind of image:
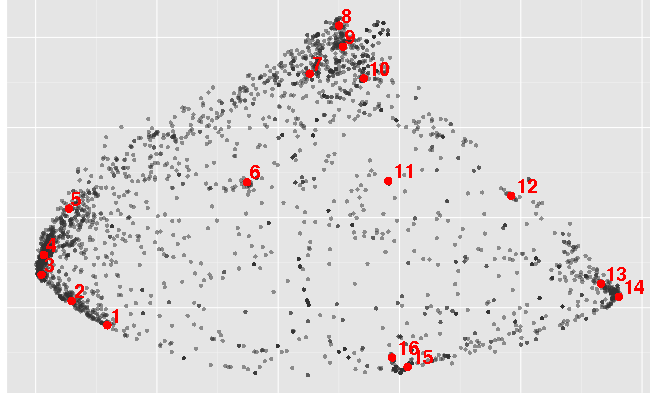
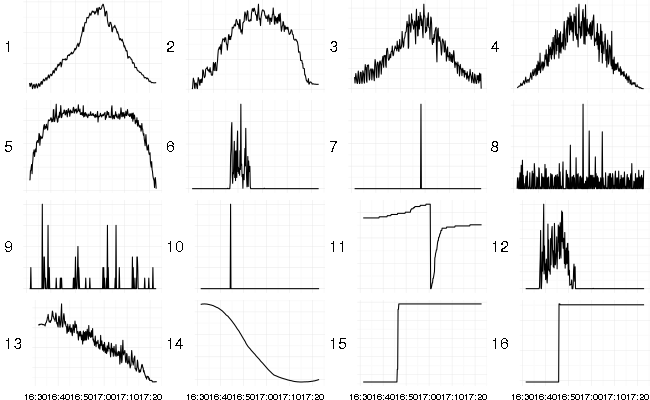
It has put hill shaped series (1 - 5) together in the left corner which seems to be the most dense one. Different kinds of spikes landed on the upper corner (7 - 10). Series with strong increasing or decreasing trend landed on the right corner (13, 14) and step-like changes on the bottom (15, 16).
This image was generated using classical (metric) multidimensional scaling using cmdscale function from R and distance matrix calculated as 1 - abs(cor(a, b)) for each pair of time series. Metric here corresponds to the set of properties of distance function required by the algorithm.
Not all time series (dis)similarity measures have these properties. There are non-metric variants of multidimensional scaling like isoMDS. It is much slower than metric MDS and in my case it produced results visually indistinguishable from cmdscale. Actually isoMDS starts by running cmdscale first and then iteratively refines its result.
t-distributed stochastic neighbor embedding (t-SNE) arranges the same data (using the same distance matrix) in a different way:
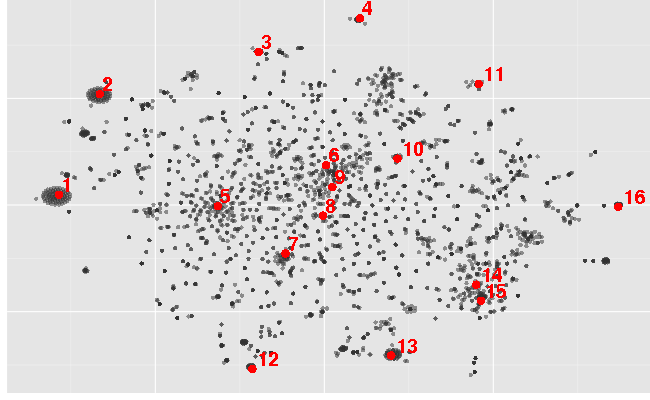
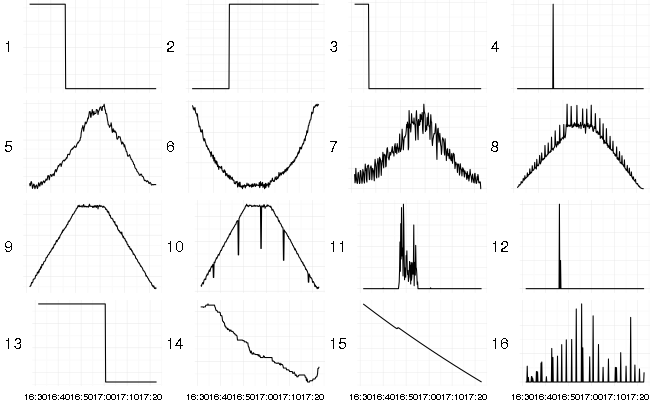
There are several clusters of step-like shapes (1 - 3, 13) and spikes (4, 11, 12, 16) around edges. Hill-like shapes are in the middle (5 - 10). Valley-like shape (6) is in the middle because the absolute value of correlation was used as the similarity function. It’s a flipped hill and abs(cor(...)) is the same for flipped series. Bottom-right side contains close to linear trend series (14, 15).
t-SNE seems to find more groups of smaller size than MDS. Large table-hill shaped group (which is in the middle) is not that clear as in MDS results. It doesn’t collapse points with zero distance into one but tries to spread them around which produces small and dense groups (1, 2). t-SNE is much slower than MDS.
When used interactively these tools are better for exploratory analysis of time series data than clustering that I used before.
I’ve made a quick demo for both methods.