Case 1: Users were experiencing slow page loads with periodical 5xx errors but the backend service looked OK with average cpu utilization about 50%. Usually it happens when some other service required to process the request is too slow but that was not the case. Sampling profiler attached to the backend showed nothing interesting in call stacks and time distribution between calls to other services was typical. The interesting thing was found on thread activity graph produced by the profiler. All the threads were busy doing something for 2 seconds and then idle for another 2 seconds like no requests were coming for 2 seconds out of 4. Load balancer logs showed that it was sending all the load to half of the cluster then declaring it down and switching to another half back and forth. Half of the cluster was unable to process all the load applied which lead to timeouts and being marked as down by load balancer.
Case 2: JMeter reported that http latency is unusually high compared to requests executed manually via curl while the load test was running. If was possible though to catch a long response once in about 10 curl requests. Profiling didn’t show any obvious bottleneck. It looked like the service was hitting cpu but average cpu usage was low. Reading JMeter csv report revealed interesting pattern. Test plan was configured with several hundred threads with ConstantThroughputTimer between requests. All threads were sending requests almost at the same millisecond then slept for some time and then again burst of requests at the same time. The service was OK to handle 100 requests per second but micro-bursts of more than 1000 per second slowed it down. Somehow delays used by ConstantThroughputTimer got synchronized between threads and they started firing at the same time.
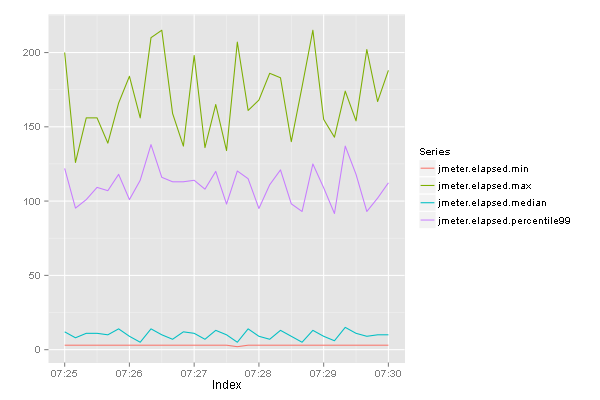
Case 3: Maximum and 99th percentile of service response time was too high under flat request rate generated by JMeter (now it was using UniformRandomTimer). Initially latency data was aggregated with 10s resolution and looked like there is some oscillation in median:
Re-aggregating data with 1s resolution confirmed it:
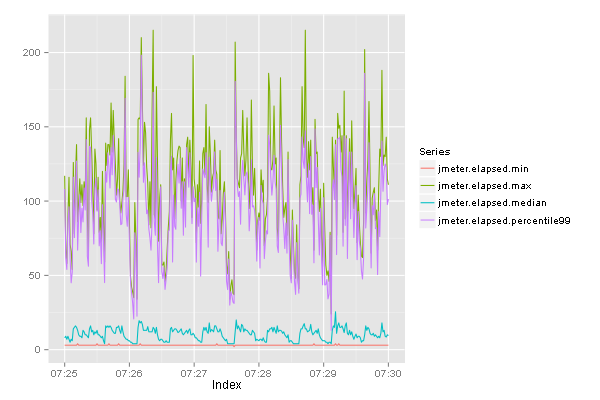
That oscillation was traced down to heavy query running every 30 seconds and slowing down the database.
What’s common in all these cases is that periodic fluctuation in load caused performance degradation but it was only visible in hi-resolution data (second or milliseconds). Visual inspection of hi-res data doesn’t scale so some method is needed to find if there is a periodical structure in a time series.
FFT periodogram (spec.pgram) produces quite unconvincing result on 10s aggregated data:
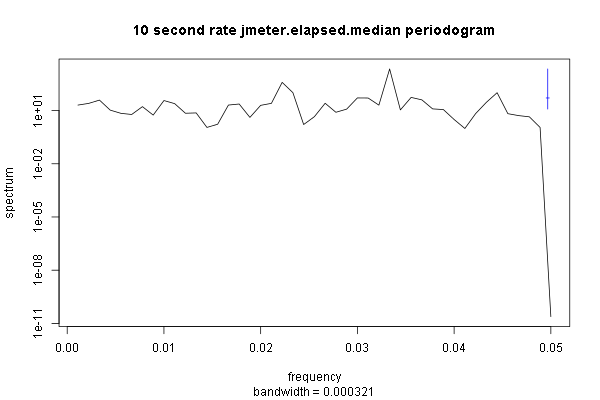
There is a spike at the expected place (frequency 0.033 which corresponds to the period of 30s) but it’s not alone and hard to distinguish from background noise. 30 seconds is larger that 20 seconds (which is a Nyquist frequency for sampling rate 10s) so it should be OK to use 10s sampling rate to catch it but it’s not. Another problem with FFT periodogram is that it doesn’t like missing data. It’s quite easy to do linear interpolation in case of several missing points though.
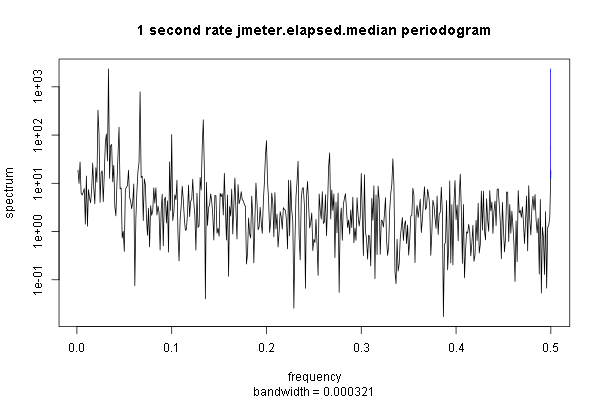
0.033 frequency spike is more pronounced on periodogram generated from 1s sampled data but the noise around it is still strong:
There is a method called Lomb–Scargle periodogram which produces more readable results on 10s data:
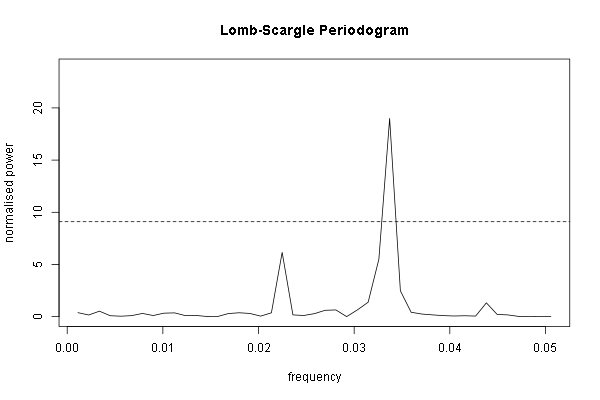
It handles missing data and irregularl samles but it’s quite slow compared to FFT.
So it’s possible to find periodic structure by observing peaks on periodograms but you still need to eyeball it. Something is needed to tell if time series has a periodical component and how significant is the component compared to background noise.
Multitaper method comes to the rescue. R implementation allows to estimate significance of spectral line in comparison to surrounding noise via F-test.
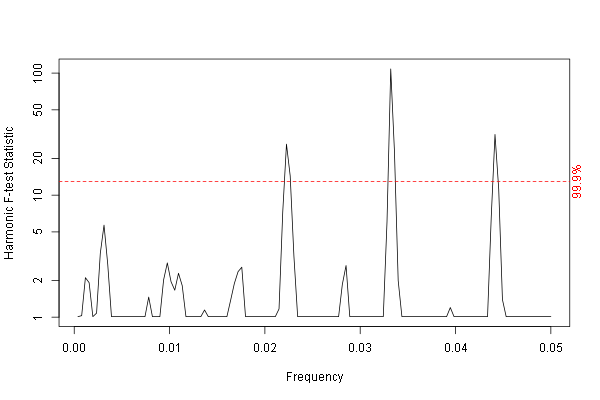
There are 22s, 30s, 45s periodical components with significance more than 99.9%
Multitaper method is still based on FFT which means that the frequency found might be a little bit off the true frequency if it’s not equal to any of component frequencies of transformation.
Due to a fixed sampling rate and a lack of low-pass filter before sampling the effect called aliasing could add more periodical components which are aliases of higher frequencies.